One Unified View of Demand, Materials & Capacity
Switch seamlessly across Routing, Demand & Purchase, Capacity, Production, Constrained Demand, and MRP Matrix.
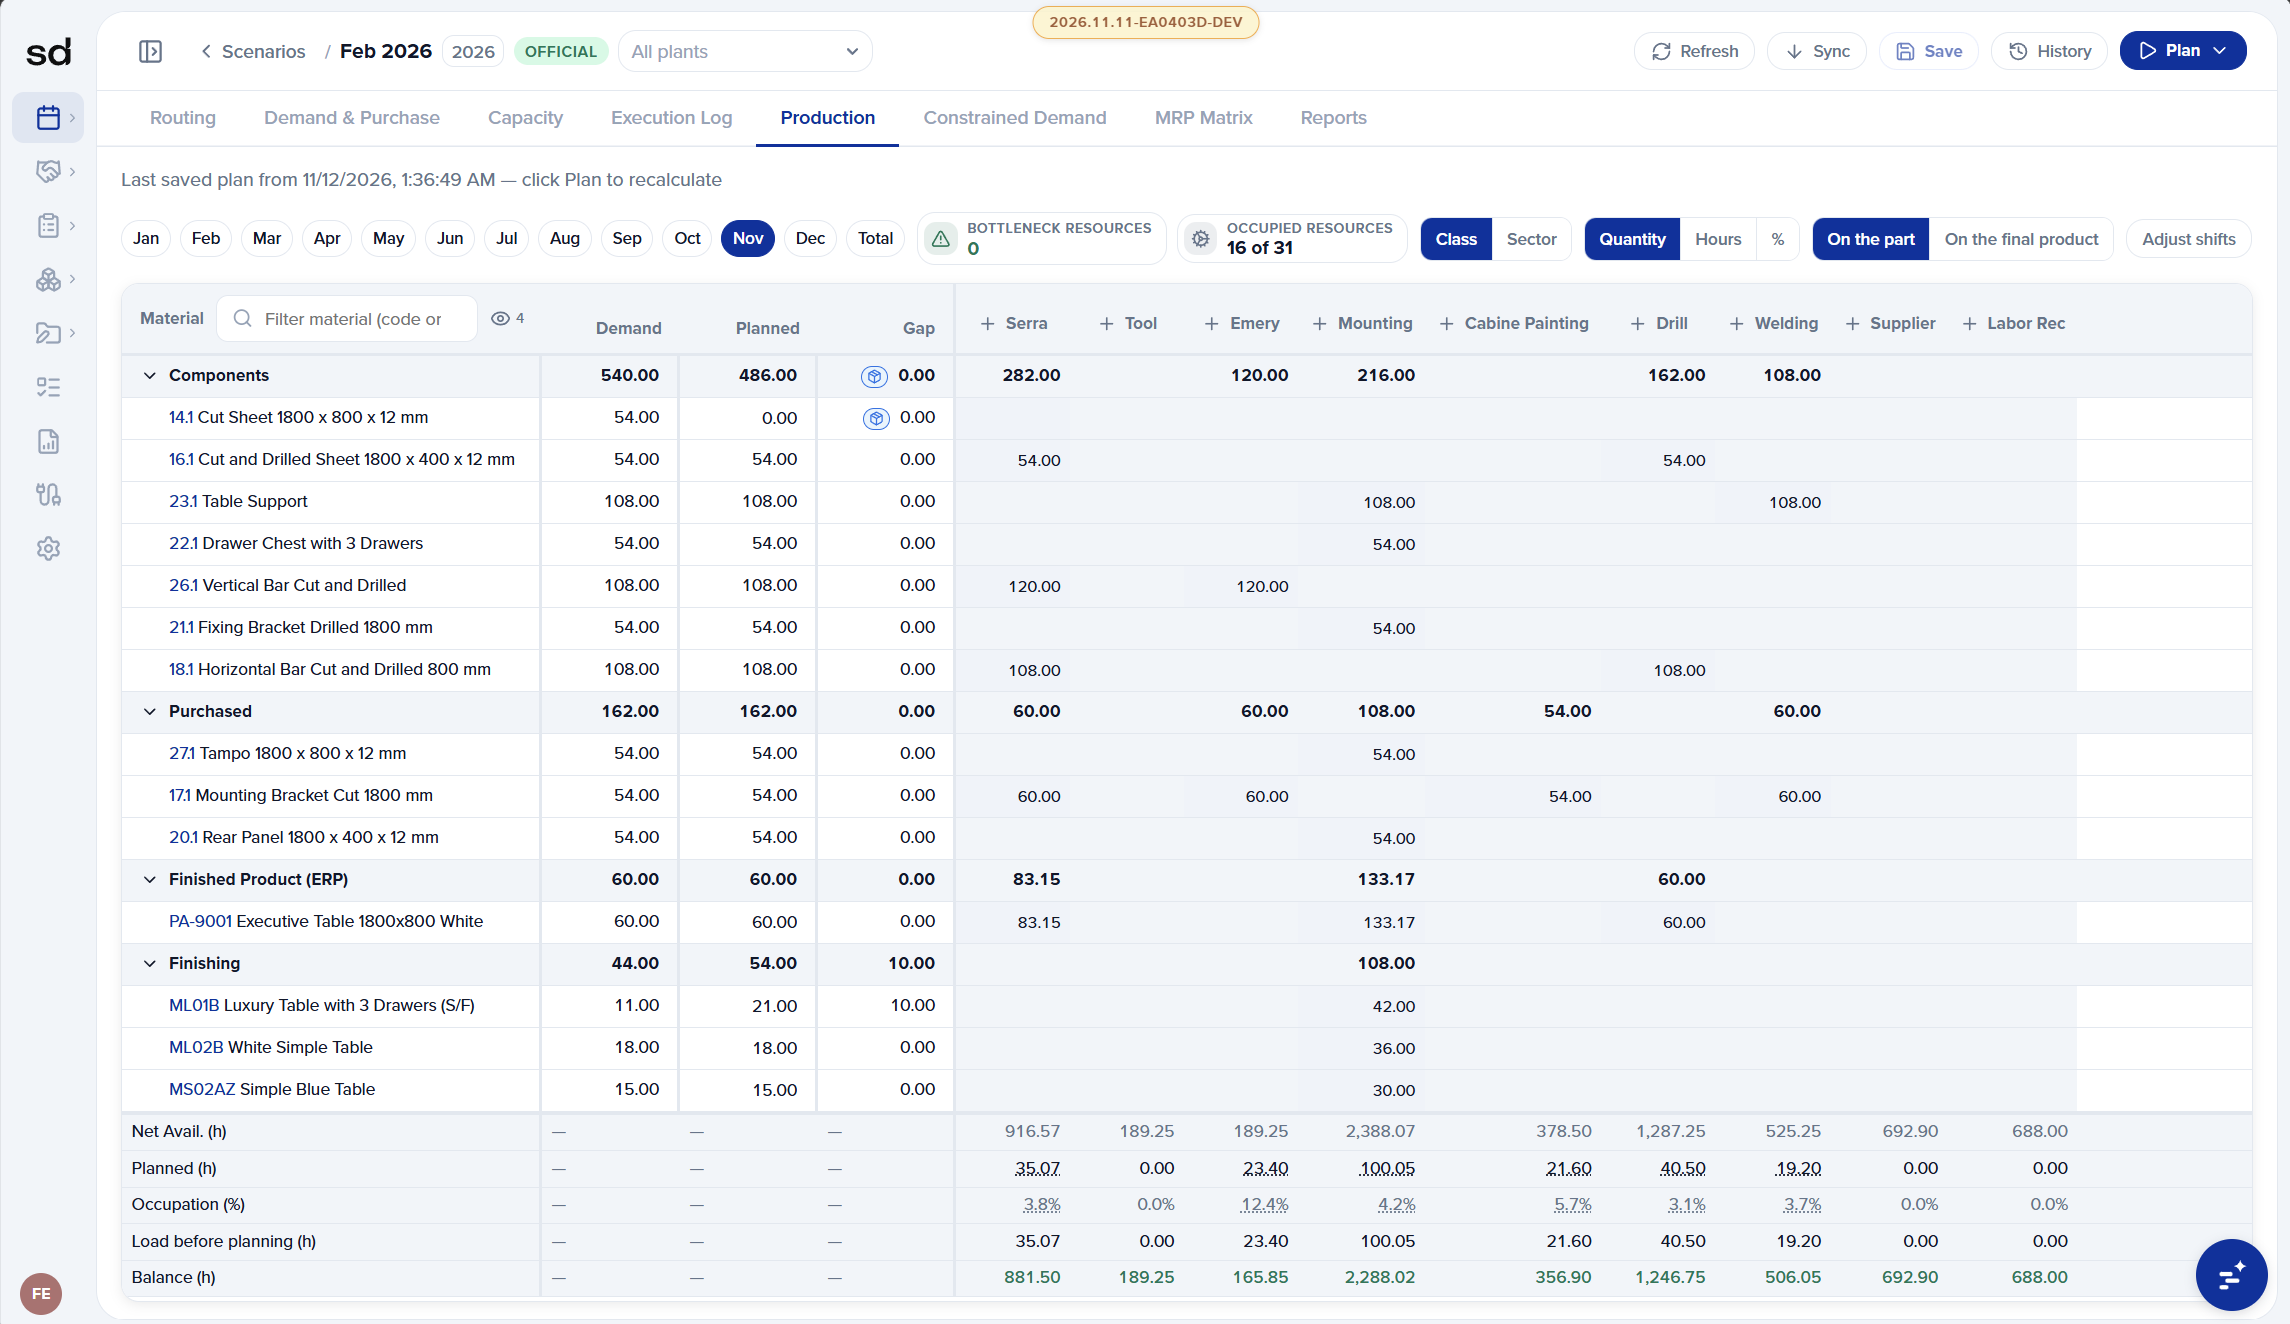
Scenario & Horizon Control
Filter across All plants or specific sites, toggle monthly buckets (Jan–Dec) or annual totals, compare official vs. what-if scenarios, and recalculate the entire plan with one click.
Demand, Planned & Gap Tracking
Every SKU and family displays Demand, Planned output, and any resulting Gap (e.g., proactive +10.00 unit inventory pre-builds in Finishing to absorb future demand peaks).
Full BOM Hierarchy Roll-Up
Drill down seamlessly across Finished Products, Finishing, Components, and Purchased items—viewing loads either on the part or rolled up on the final product.
Live Resource Load & Balance
Track real-time KPIs at a glance: Bottleneck Resources, Occupied Resources (16 of 31), Net Available Hours, Planned Hours, Occupation %, and remaining Balance (h) per work center.